
Healthcare Data Analytics: Understanding Methods, Tools, And Use Cases

Visualization and Reporting Approaches in Healthcare Data Analytics
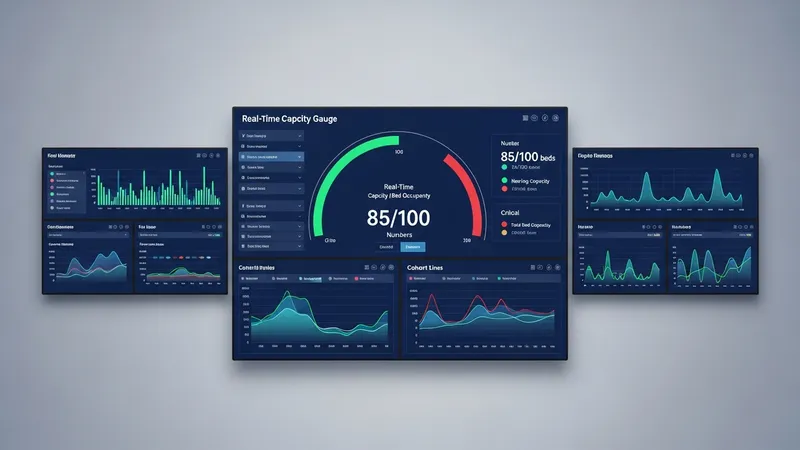
Visualization choices commonly reflect the audience and decision tempo: operational managers may need near-real-time capacity views, while quality committees often prefer periodic cohort reports. Business intelligence tools and dashboard platforms are frequently used to consolidate multiple data sources into interactive views. Visualization best practices in this domain often emphasize clarity, minimal cognitive load, and explicit definition of denominators and time windows to prevent misinterpretation of metrics.
Designing dashboards for clinical settings may include features such as role-specific filters, alerts for threshold breaches, and drilldown paths to case-level detail. Refresh cadence is important; some metrics may update hourly while others update daily or weekly depending on source system constraints. Documentation accompanying dashboards that describes data definitions and refresh schedules can help set expectations and reduce misalignment between users and analytics teams.
Reporting workflows sometimes integrate statistical summaries and simple modeling outputs, such as risk-stratified cohorts for outreach. When predictive elements appear in reports, transparency about model inputs, performance metrics, and limitations is typically included to aid interpretation. Calibration plots, confusion matrices, or summary performance statistics can be provided for technical audiences, while clinical summaries focus on actionable groupings and recommended next steps for review.
Operationalization of reporting often involves automation of extract-transform and delivery steps to preserve consistency and timeliness. Scheduling, monitoring, and error-handling mechanisms may prevent stale or incomplete reports from circulating. Access control and versioning of reports are common governance controls so stakeholders reference validated outputs rather than ad hoc spreadsheets.