
Indoor Air Quality Sensor: Key Metrics Measured And What They May Indicate

Key metrics and interpretations for Indoor Air Quality Sensor
Particulate measurements often report mass concentrations for size fractions such as PM2.5 and PM10 or particle counts within size bins. Elevated fine-particle readings may stem from combustion activities, outdoor infiltration, or resuspension of settled dust. Trends over time can indicate whether increases are episodic or persistent. Carbon dioxide is commonly reported in parts per million; higher sustained indoor concentrations can suggest limited ventilation relative to occupancy, though CO2 itself is one indicator among several and does not quantify specific contaminants. Both particulate and gas measurements often require contextual information for meaningful interpretation.
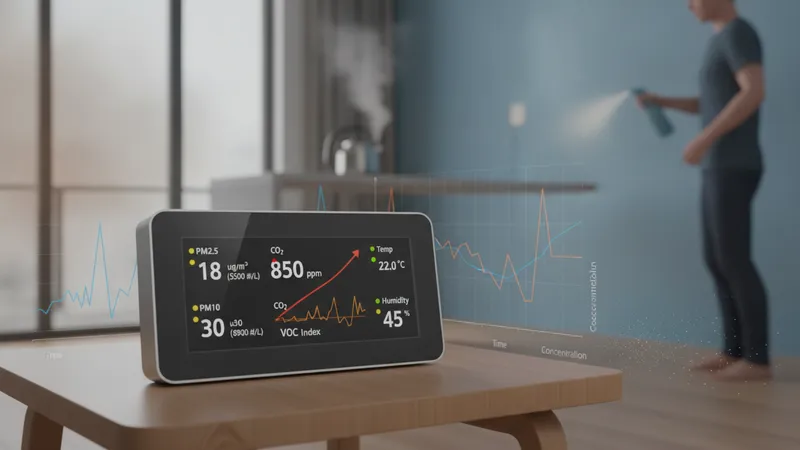
Volatile organic compound measurements vary by sensor type and reporting method: PIDs and metal-oxide detectors may provide a composite VOC index or relative signal rather than concentrations for individual chemicals. That composite signal can indicate the presence or fluctuation of organic emissions from activities such as cleaning, painting, or off-gassing from materials. Temperature and relative humidity readings help interpret sensor performance and occupant comfort context; humidity can also influence particle hygroscopic growth, affecting size and optical detection. Using multiple metrics together often yields a clearer understanding than single-parameter readings.
Thresholds and comparative references are often used cautiously. Many organizations and studies report ranges that are commonly observed in occupied buildings, but there is no universal single threshold that applies across all environments and contaminants. Short-term spikes in particulates or VOCs may occur during specific activities and then subside, while persistent elevations may indicate ongoing sources or inadequate ventilation. Analysts may compare indoor measurements to outdoor baselines or historical indoor averages to assess anomalies, keeping in mind that interpretation should consider context, sensor limitations, and measurement uncertainty.
Time series analysis usually clarifies patterns that instantaneous readings cannot. Diurnal patterns, occupancy-correlated changes, and responses to interventions can be evident when data are logged at regular intervals. For instance, particle counts may rise during cooking periods and return toward baseline afterward, whereas continuously elevated gas or particle levels could suggest a background source. Data smoothing, moving averages, or event tagging can assist interpretation. Users typically treat sensor outputs as indicators that may prompt further investigation rather than as definitive proof of specific conditions.